US trucks at port

US container gateways face pressure beyond the docks

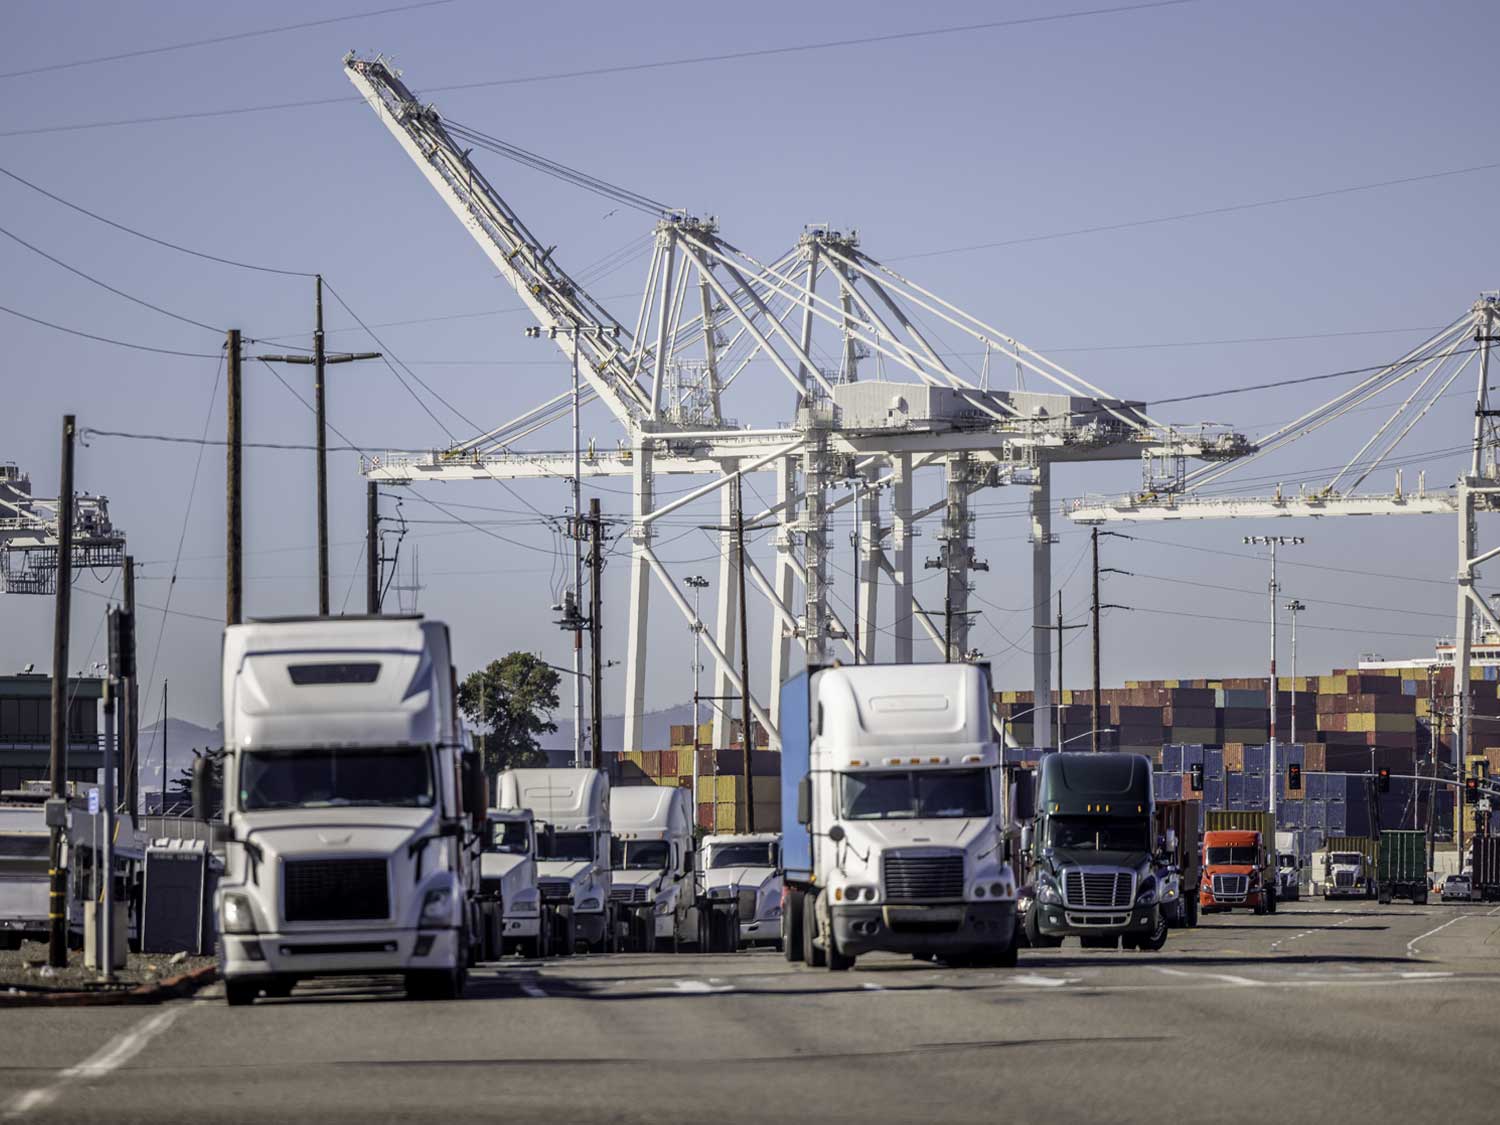
Strong import volumes, tightening trucking capacity and mounting difficulties returning empty containers are creating new challenges at major US ports, threatening delivery efficiency and increasing inland logistics costs.

The pressures affecting America's container gateways are changing. While vessel congestion and terminal capacity have traditionally dominated attention, increasingly the challenge is moving containers efficiently between ports, inland destinations and equipment return facilities.

From Southern California to Houston and New York–New Jersey, different operational problems are producing a common result: longer truck journeys, reduced equipment availability and rising costs.

With the traditional import peak extending into October, these constraints are proving difficult to resolve, even where marine terminals continue to handle cargo effectively.

Southern California struggles with empty container accumulation

The ports of Los Angeles and Long Beach continue to handle substantial import volumes, with US imports from Asia reaching 1.8 million TEU in September, up 14% year on year.

Approximately half of these shipments enter through Southern California, where imports during the first nine months of 2026 increased 6% compared with 2025.

However, the sustained influx is creating growing difficulties with empty container returns.

Trucking operators report that inconsistent terminal acceptance policies and restrictions on returning empties are leaving containers accumulating in storage facilities and occupying valuable terminal space.

Some industry representatives also question whether sufficient empty equipment is being repositioned to Asia, although terminal operators maintain that containers are being evacuated and port operations remain manageable.

The operational impact is becoming more apparent. Average truck turnaround times at Los Angeles and Long Beach reached 63 minutes in September, their highest since November 2025.

More significantly, the proportion of truck visits taking at least two hours increased from 7% in April to 11% in September.

These extended turnaround times reduce driver productivity, limit available trucking capacity and increase the cost of moving containers away from the ports.

Houston's growth is stretching inland transport

The challenges at Houston are different, but the consequences for cargo owners are similar.

Rapid manufacturing expansion across Texas, investment in artificial intelligence infrastructure and growing demand for equipment and materials are generating substantial additional cargo movements.

Houston's container throughput increased 3% year on year during the first half of 2026, while loaded imports through August rose approximately 5%. Imports from Asia increased nearly 12%.

Additional demand is coming from cargo diverted away from other gateways, shipments destined for Mexico and stronger resin exports following disruption to competing Middle Eastern suppliers.

This growth is stretching the availability of local trucking services. Houston drayage rates have reportedly increased by approximately 34% year on year, compared with a national average increase of 18%.

Some operators have experienced increases of around 40% over four months.

The pressure reflects a tightening trucking market, with drivers moving from port drayage into long-haul transport during the extended peak season.

Although Houston's port and chassis infrastructure continues to handle the higher volumes relatively effectively, securing trucking capacity has become a significant concern.

For importers and exporters, early arrangements for drayage and specialist equipment are becoming increasingly important.

New York–New Jersey highlights a nationwide equipment problem

On the US East Coast, the challenge is less about the volume of containers arriving than the difficulty of returning empty equipment after delivery.

Trucking operators at the Port of New York and New Jersey have asked the Federal Maritime Commission (FMC) to introduce enforceable rules governing empty container returns.

The proposed measures would require ocean carriers to provide accurate return locations, ensure designated facilities can accept containers and compensate trucking operators when returns cannot be completed.

Currently, drivers can be directed to terminals without available appointments or off-dock depots that have already reached capacity.

The result is wasted journeys, additional fuel and labour costs, and containers occupying chassis and storage space that could otherwise support new cargo movements.

Industry representatives estimate that only 30% of truckers at the gateway can return an empty container and collect a loaded import during the same terminal visit.

This significantly reduces transport productivity and creates additional costs throughout the supply chain.

The FMC has received the petition, but any regulatory changes would require further review and consultation.

Why port congestion is no longer just a terminal issue

Although the circumstances differ between gateways, the underlying problems are closely connected.

Strong imports increase the demand for container handling, trucking and equipment repositioning. When empty containers cannot be returned efficiently, they occupy chassis, storage space and driver time.

This reduces the capacity available to move loaded containers, creating further pressure even where port terminals are operating normally.

The consequences can extend well beyond the gateway itself. Longer turnaround times and constrained trucking availability affect inland distribution schedules, increase costs and reduce the flexibility available to importers.

Changing port selection may provide alternatives, but it can also transfer pressure to other gateways, as Houston's growing volumes demonstrate.

What this means for shippers

The latest developments highlight three important considerations for businesses moving goods through US ports.

  • Gateway selection requires a wider assessment. Ocean schedules and freight rates need to be considered alongside terminal performance, drayage availability, inland connections and equipment return arrangements.
  • Empty container management affects delivery costs. Delays returning equipment can generate additional trucking, chassis and storage charges, even after cargo has reached its destination.
  • Early inland planning is becoming essential. Securing trucking capacity, coordinating collection appointments and anticipating equipment constraints can help protect delivery schedules during periods of elevated demand.

Connecting US gateways with reliable inland delivery

Securing an ocean booking is only part of the solution. The real challenge is ensuring containers move efficiently from vessel arrival through customs, inland transport and final delivery.

Metro's expanding US network combines international ocean freight expertise with local gateway knowledge, customs brokerage, inland transport coordination and established relationships with logistics partners.

Our teams monitor port conditions, trucking availability and equipment constraints, helping customers evaluate alternative gateways, coordinate container collections and manage the complete import or export movement.

Whether you're experiencing delays in Southern California, rising inland costs through Houston or container return challenges on the East Coast, Metro can help identify practical solutions that protect delivery performance and control total logistics costs.

FXT at dawn

Global container trade breaks records as demand outpaces disruption

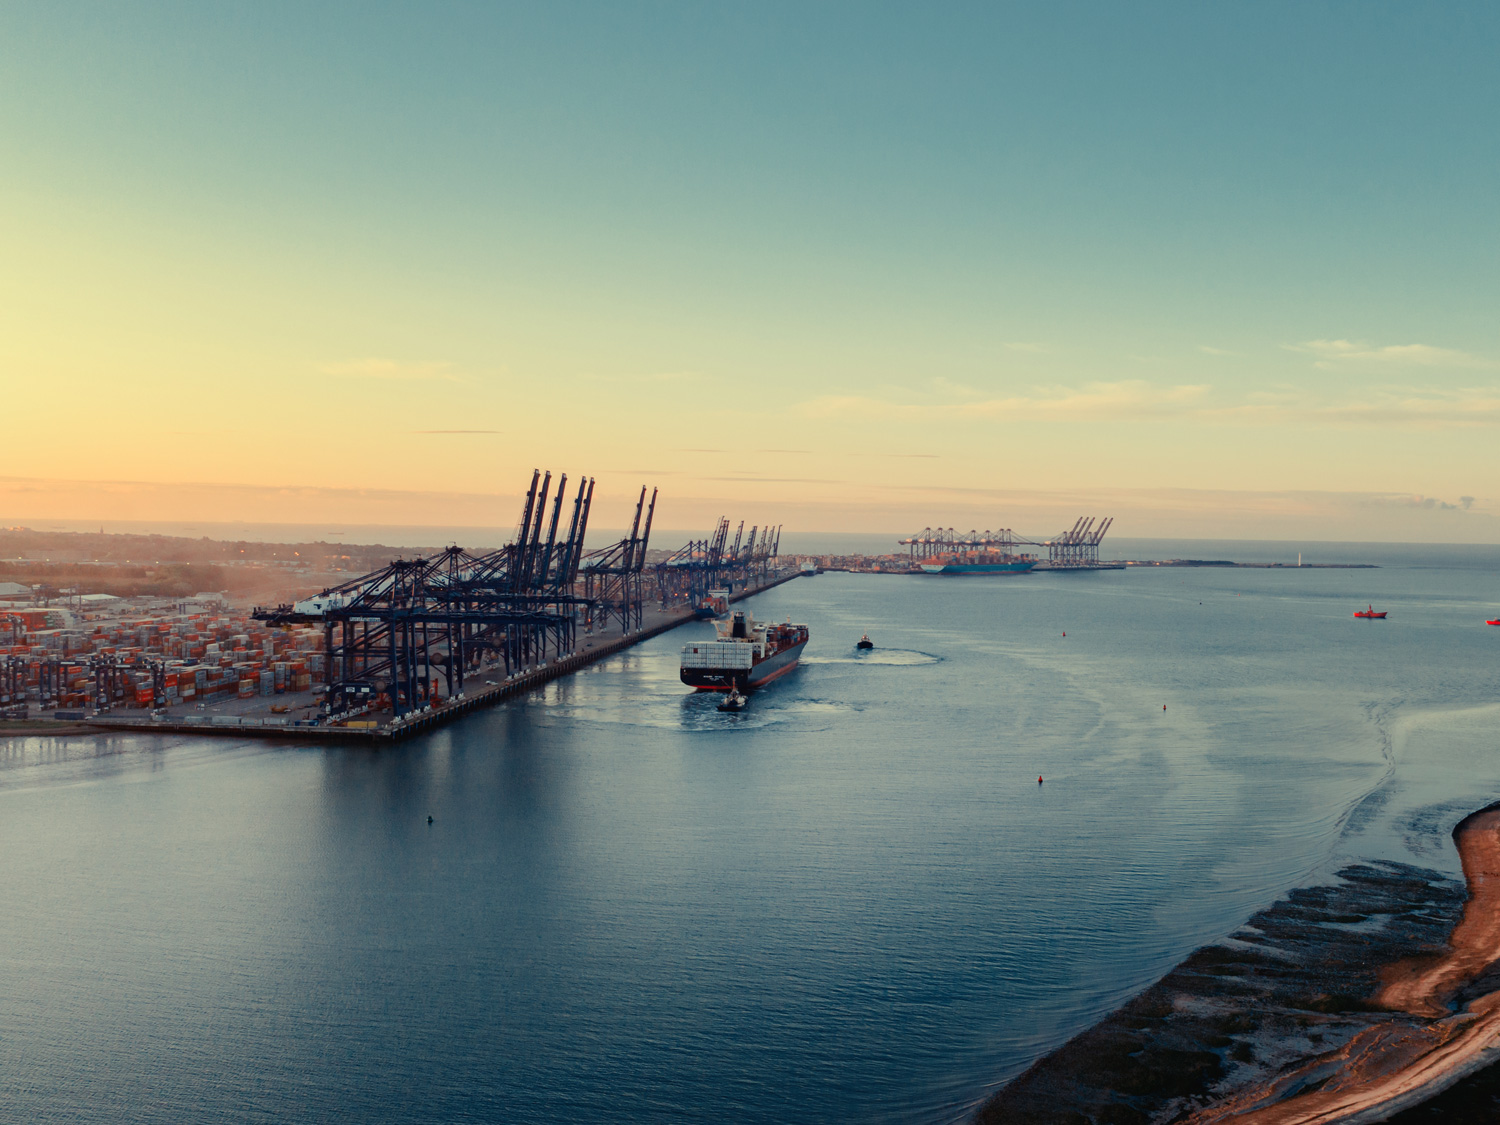
Global container volumes have reached another record high, with expanding trade flows across Asia, the Americas and Africa demonstrating the resilience of international commerce despite geopolitical uncertainty, rising transport costs and persistent shipping disruption.

Global container trade reached 17.46 million TEU in August 2026, surpassing July's previous record and marking the second consecutive month of unprecedented volumes.

The latest figures reveal an international trading environment that continues to expand despite considerable operational and economic challenges. Container volumes increased 3.7% compared with August 2025, while cumulative growth for the first eight months of 2026 reached 4.7%.

Looking further back, August volumes were 7.2% higher than in 2024 and 12.9% above 2023, highlighting the sustained expansion of containerised trade.

Asia drives growth as trade patterns evolve

The Far East remains the principal engine of global container trade, with exports increasing 8% year to date, equivalent to approximately 6.3 million additional TEU.

Every destination region recorded growth in imports from the Far East, with Sub-Saharan Africa and South and Central America delivering particularly strong percentage increases.

Sub-Saharan Africa also recorded the fastest overall import growth, up 13%, highlighting the growing importance of emerging consumer and industrial markets.

North American imports have returned to positive territory, increasing 2% year to date following a weaker start to 2026. Transpacific volumes are now 5% higher, supported by renewed demand for Far Eastern goods.

European exports have also stabilised after contracting earlier in the year, suggesting a gradual improvement in trading conditions.

However, growth remains uneven. Imports into the Indian Sub-Continent and Middle East declined 5%, while exports fell 10%, reflecting the significant disruption affecting regional trade flows.

These differences reinforce the importance of examining individual markets rather than relying on global averages when planning international supply chains.

Record volumes are adding to shipping costs

The strength of container demand has coincided with substantial freight pricing pressure.

The global container freight price index reached 117 points in August, its highest level since July 2024. The index has increased approximately 50% since January and stands 44% above August 2025.

The increase reflects more than cargo demand alone, with geopolitical disruption, longer vessel routings, congestion and constraints affecting major shipping corridors reducing the amount of vessel capacity effectively available to the market.

Ships diverted around the Cape of Good Hope spend longer completing voyages, while delays and congestion absorb capacity that would otherwise support additional sailings.

Consequently, even substantial investment in new vessels does not necessarily translate into improved availability or lower costs.

The distinction between the size of the global container fleet and the capacity that can actually be deployed remains fundamental to understanding freight market conditions.

Growth is continuing, but the outlook is changing

Despite August's record, there are early indications that the pace of expansion may be moderating.

Volumes increased just 0.5% compared with July, suggesting that the exceptional momentum seen during the middle of 2026 could be approaching a turning point.

Meanwhile, the global containership order-book represents more than 46% of the existing fleet, with substantial new capacity scheduled for delivery during 2027 and 2028.

This creates the prospect of a different market balance. If trade growth moderates while new vessels enter service, the additional capacity could place downward pressure on freight rates, particularly as more shipping services resume shorter routes through Suez.

However, the transition is unlikely to be uniform. Carrier capacity management, port congestion, regional demand and geopolitical developments will continue to influence individual trades, potentially creating significant differences between headline market trends and the conditions experienced by shippers.

For businesses planning ahead, the challenge is to distinguish between temporary disruption, underlying demand growth and longer-term changes in available capacity.

Connecting growing markets with global capability

As international container trade reaches new highs, businesses need more than access to shipping space. They need the expertise, relationships and visibility to take advantage of changing trade patterns while controlling costs and protecting delivery performance.

Metro combines established global carrier relationships, competitive ocean freight procurement and extensive international logistics capabilities with local expertise across major sourcing and destination markets.

Our expanding presence in India and the US strengthens our ability to support changing trade flows, while our ocean freight, consolidation, customs and inland transport services provide coordinated solutions from origin to final delivery.

Whether you're expanding into new markets, reviewing your freight strategy or preparing for the next shift in container shipping capacity, Metro can help turn changing global trade conditions into a competitive advantage.

Contact Metro to review your international shipping requirements and identify the routes, services and opportunities that best support your business.

Golden Week

Post-Golden Week capacity pressures diverge

Container shipping lines are adjusting capacity as Asian factories resume production following Golden Week, with relatively few cancelled sailings but contrasting conditions emerging on routes to Europe and the United States.

As China's Golden Week holiday ends and export activity resumes, attention is turning to the availability of container shipping capacity across the major east–west trades.

Carriers traditionally cancel sailings during and immediately after the holiday to balance vessel capacity against temporarily reduced cargo volumes.

This year, however, announced cancellations remain relatively modest, even as shipping lines pursue freight rate increases and adjust their networks to changing demand and routing conditions.

The result is a market in which overall capacity appears relatively plentiful, but individual trade lanes and services may present very different challenges for shippers.

Blank sailings remain below historical levels

Drewry's latest Cancelled Sailings Tracker, published on 9 October, identifies 34 blank sailings across the major east–west trades between Weeks 42 and 46, covering 12 October to 15 November.

That represents just 5% of 713 scheduled voyages, meaning 95% of planned sailings are expected to operate.

The cancellations are distributed unevenly:

  • Asia–North Europe and Mediterranean: 50% of announced cancellations.
  • Trans-Pacific eastbound: 32%.
  • Transatlantic: 18%.

The figures represent a relatively low level of capacity withdrawal compared with post-pandemic patterns.

Sea-Intelligence analysis indicates that approximately 10% of Asia–US West Coast sailings have typically been cancelled during comparable periods since 2020, with recent blanking levels running below that average.

Asia–North Europe and Mediterranean services have also experienced comparatively low cancellation levels.

However, aggregate figures can disguise the impact on individual shippers.

A cancelled sailing may represent only a small proportion of overall capacity but can create significant problems for cargo booked on the affected service, particularly when alternative departures are limited.

Asia–Europe faces increasing capacity pressure

The Asia–Europe trade is experiencing a more complicated adjustment as carriers gradually restore services through the Suez Canal.

Shorter routings compared with diversions around the Cape of Good Hope are increasing effective vessel capacity, potentially placing downward pressure on freight rates.

The return of capacity coincides with relatively steady post-Golden Week bookings and limited overall sailing cancellations.

Carriers have nevertheless announced plans for freight rate increases during the second half of October, despite reducing some rates earlier in the month.

This apparent contradiction reflects the uncertainty surrounding the balance between cargo demand, available vessel space and carriers' capacity management strategies.

Drewry's World Container Index declined 2% in the week to 8 October, with rates easing across the major east–west trades.

For European importers, the additional capacity could create opportunities, although the timing and reliability of individual services remain important.

More available vessel space does not necessarily mean more predictable deliveries.

Port congestion, schedule adjustments and changes to vessel rotations can still disrupt shipments, particularly where cargo depends on feeder connections or transhipment services.

Trans-Pacific conditions remain different

The trans-Pacific market presents a contrasting picture.

Although the trade accounts for 32% of announced blank sailings during Weeks 42–46, the relatively limited number of cancellations suggests carriers are maintaining most scheduled services as Asian export activity resumes.

Recent market analysis indicates that trans-Pacific blanking levels remain low compared with historical patterns, despite carriers continuing to manage capacity and support freight rates.

Demand conditions also differ from those on Asia–Europe routes, with US import requirements and changing sourcing patterns influencing cargo flows.

The return of Chinese manufacturing activity after Golden Week could increase booking pressure on individual departures, particularly where pre-holiday shipments have been rolled or delayed.

For US importers, the immediate challenge is therefore less about widespread sailing cancellations and more about securing reliable space on the services that meet their delivery requirements.

Even where overall capacity appears sufficient, individual ports, departure dates and carrier services may experience tighter availability.

Carrier reliability varies across alliances

The latest Drewry figures also highlight differences between carrier networks. For Weeks 42–46, the proportion of scheduled sailings expected to operate ranges from 89% for Premier Alliance to 99% for Gemini Cooperation.

MSC and Ocean Alliance are expected to operate 97% and 98% of planned sailings respectively, while independent carriers and other services are forecast to operate 93%.

These differences underline the importance of assessing individual carrier schedules rather than relying solely on overall market capacity. However, a sailing operating as scheduled does not guarantee an on-time arrival.

Port congestion, vessel delays, equipment availability and changes to port rotations can still affect cargo movements, even when a scheduled departure is not cancelled.

This makes early booking, alternative routing options and accurate shipment visibility increasingly valuable.

Metro connects Asian origins with Europe and the USA

Working alongside Metro's wider international network, our UK and US teams support customers with origin planning, carrier selection, shipment visibility and destination coordination.

As post-Golden Week schedules settle, Metro can help shippers distinguish between published capacity and practical availability, anticipate disruption and secure services that meet their operational requirements.

Protect your supply chain. Let Metro's sea freight experts review your upcoming shipments, assess carrier schedules and identify reliable transport options before changing capacity conditions disrupt your product flows.

Saudia air

Airfreight demand and Middle East disruption tighten peak-season

Airfreight markets are entering the fourth-quarter peak season with demand strengthening, capacity tightening on key routes and renewed disruption in the Middle East adding pressure to airline networks and transport costs.

Global air cargo demand recovered strongly in September, with worldwide tonnages increasing 9% year on year, according to WorldACD. Growth was particularly strong across Asia Pacific and North America, where volumes increased 10%.

The recovery reflects continued demand for high-value and time-sensitive shipments, particularly equipment supporting artificial intelligence, data centres and semiconductor manufacturing.

However, the market is becoming increasingly uneven, with trans-Pacific demand accelerating, China–Europe volumes recovering only gradually and Middle East disruption affecting available capacity.

Peak-season demand strengthens despite temporary rate dip

Airfreight rates edged higher throughout September as shippers prepared for the traditional fourth-quarter peak.

Worldwide average rates increased 1% month on month and stood 25% above September 2025 levels, reflecting stronger demand, elevated fuel costs and continuing capacity constraints.

The Baltic Air Freight Index subsequently rose 5% in the week to 5 October before easing 2.1% during China's Golden Week holiday, when factory closures temporarily reduced export volumes.

Despite that decline, the index remained 24.3% higher year on year as the market entered its busiest quarter.

Capacity commitments are already influencing the outlook. Major e-commerce operators and businesses preparing product launches have secured peak-season space, while some large AI infrastructure customers have yet to finalise their requirements.

Additional bookings from these shippers could tighten available capacity and push rates higher during the coming weeks.

AI infrastructure drives trans-Pacific growth

The expansion of AI infrastructure has become a significant driver of air cargo demand, particularly between Asia and North America.

Large volumes of servers, semiconductors, data-centre equipment and energy storage systems are moving from manufacturing centres in Taiwan, South Korea, Vietnam and China to support US investment in digital infrastructure.

Trans-Pacific airfreight volumes increased 10% year on year in September, with outbound Asian load factors approaching 90%, despite airlines increasing capacity by approximately 10%.

The strength of demand is also influencing airline deployment decisions, with freighters being transferred from other routes to serve the trans-Pacific market.

WorldACD figures reinforce the trend, showing China–US air cargo tonnages increasing 17% year on year in September, while average spot rates rose approximately 30%.

Ocean freight disruption could add further pressure. Schedule reliability from Asia to the US West Coast reportedly fell from 56% in May to just 26% in September, increasing the potential for urgent shipments to transfer to airfreight.

Saudi attacks create further capacity uncertainty

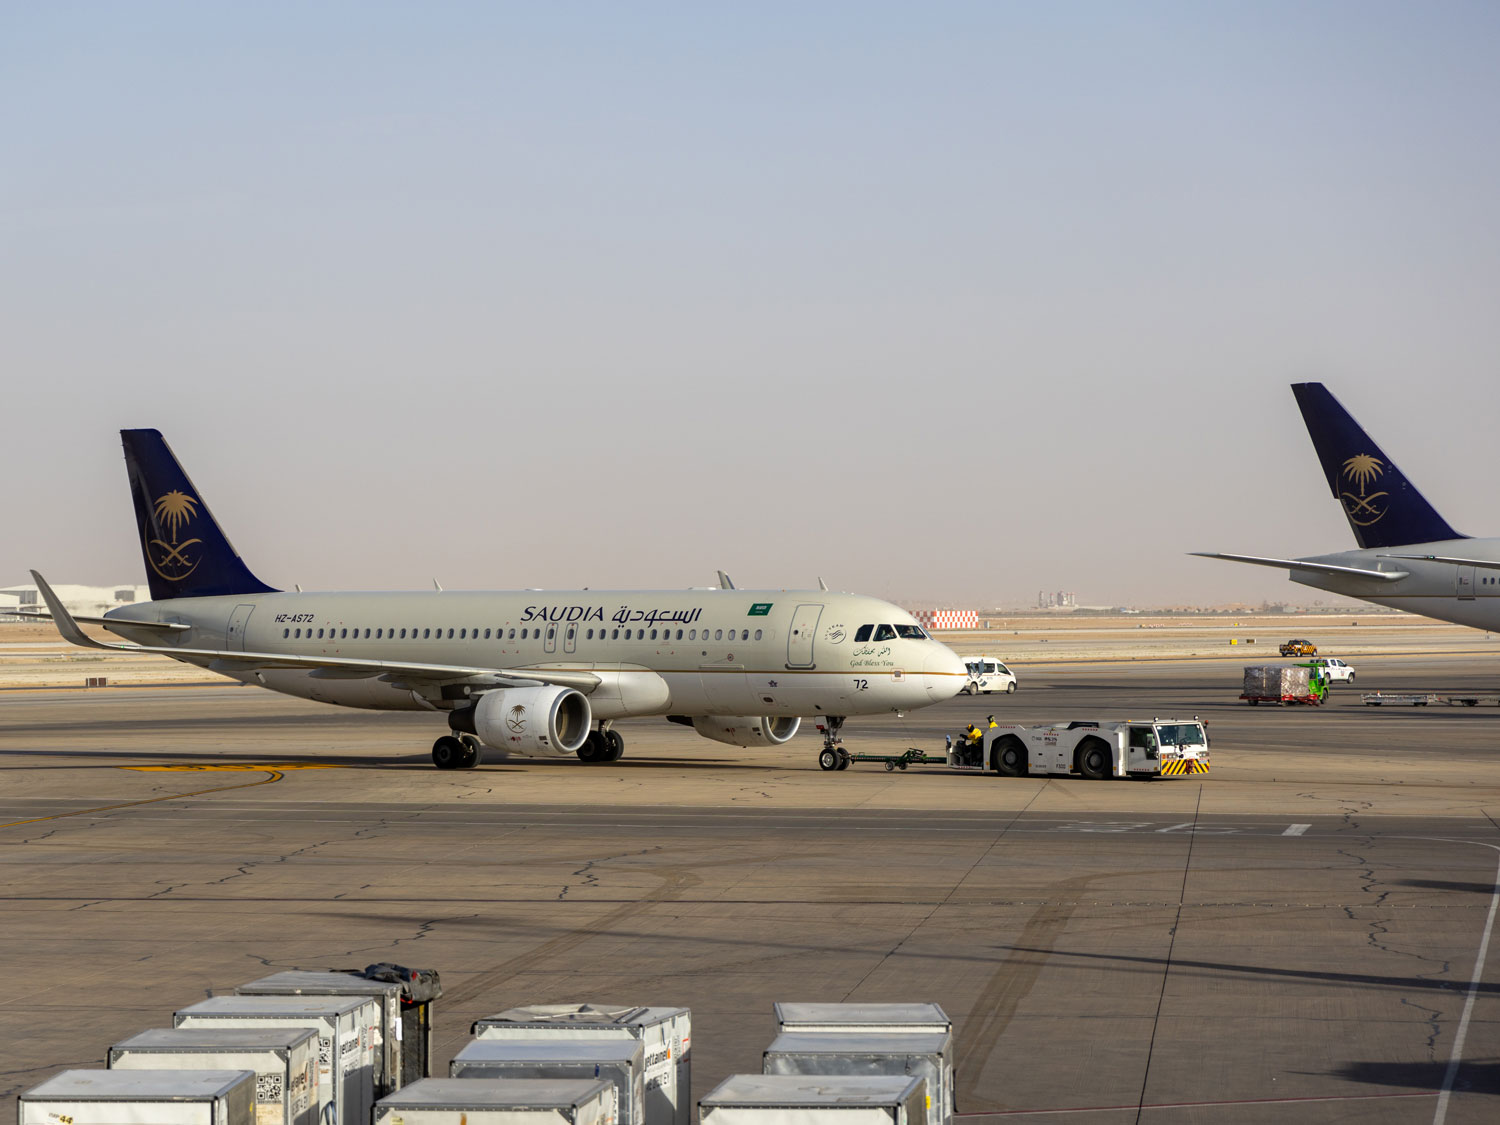
Renewed attacks on Saudi Arabian airports have introduced another source of disruption as the peak season gathers pace.

Following strikes on Riyadh's King Khalid International Airport and other Saudi facilities, airlines suspended services and authorities imposed operational restrictions.

Initial data showed Riyadh's international outbound air cargo capacity falling 34% over 24 hours, with freighter capacity particularly affected.

Further attacks prompted an extended suspension of operations at Riyadh on 12 October, while Dammam International Airport also experienced disruption.

The immediate consequences extend beyond Saudi Arabia. Airlines operating between Asia and Europe have already been adjusting their networks following wider Middle East disruption, including the loss of established intermediate stops.

Alternative routings can increase flying times, introduce payload restrictions and reduce the effective capacity available to shippers.

With peak-season demand building, prolonged restrictions could intensify competition for available space, particularly on routes connecting Asia, the Middle East and Europe.

China–Europe recovery remains uneven

While trans-Pacific demand continues to strengthen, the China–Europe market presents a different picture.

Combined air cargo volumes from mainland China and Hong Kong to Europe fell 10% year on year in September, although this represented an improvement on declines of 14% in July and 15% in August.

The downturn reflects changes to EU treatment of low-value e-commerce imports, which have affected shipments from Hong Kong and southern China.

Hong Kong–Europe tonnages remained 24% below September 2025 levels, while mainland China recorded a more modest 2% decline.

Rates have reflected this divergence, with China–Europe average prices increasing approximately 9% year on year in September, compared with a 30% increase in China–US spot rates.

The figures highlight how demand, regulation and available capacity are creating increasingly different conditions across major airfreight corridors.

Planning ahead as capacity tightens

The fourth-quarter outlook points towards sustained demand, particularly on trans-Pacific routes, with further potential for rate increases as remaining peak-season capacity is committed.

Saudi Arabian disruption adds uncertainty to an already constrained market, while higher fuel costs and shifting airline networks could affect availability and pricing across other trade lanes.

For shippers, early planning, accurate forecasts and flexibility over routing and departure dates will be increasingly important.

Metro's global airfreight network, airline relationships and experienced operational teams help customers secure capacity, assess alternative routings and respond quickly when market conditions change.

Whether managing regular shipments, urgent requirements or time-critical cargo, Metro combines international buying power with local expertise and shipment visibility to keep supply chains moving.

Contact Metro's airfreight team to review your peak-season requirements, protect critical shipments and identify the most effective options before capacity becomes constrained.